
March Madness, Meet Mathematical Optimization: Cutting 34,000 Miles of Travel with Smarter Scheduling

Published on March 22, 2025 by Brian Schaefer
Every March, 64 college basketball teams punch their ticket to the Big Dance—March Madness. While the bracket brings plenty of drama on the court, there’s another part of the tournament that gets less attention: how far teams have to travel for their first-round games.
We wondered: what if we could use optimization to cut down on that travel?
At SimpleRose, we build powerful optimization tools to solve all kinds of problems, from logistics to scheduling to supply chains. But just for fun, we decided to see what would happen if we asked one simple question:
What if the only thing that mattered was minimizing travel distance?
The Setup
We built a mathematical optimization model that assigns each of the 64 teams in the men’s NCAA tournament to one of the eight designated first-round game sites—while making sure each site hosts the correct number of teams and matchups.
Our objective: minimize the total travel distance across all 64 teams to their first round game.
In the actual 2025 men’s bracket, the total round-trip travel distance to the first round arenas was 102,000 miles for all 64 teams. That’s more than four times around the Earth!
Our Results
But what happens when we let our solver work its magic?
Our model keeps the tournament structure intact—1-seeds still play 16-seeds, 8-seeds still play 9-seeds, and so on—but it allows flexibility in which specific teams face each other within those seed pairings. That gave the solver room to minimize travel distance while still respecting the bracket format.
The teams can be arranged such that the round-trip travel distance is only 68,000 miles, a savings of 33%. That’s a reduction of 34,000 miles—about the distance of 14 flights from New York to Los Angeles.
Teams located within 350 miles of their game travel by bus, while the NCAA arranges charter flights for the rest. In the actual travel plan, 17 teams travel by bus. In our optimized plan, 25 teams can travel by bus. That’s a savings of 16 expensive flights.
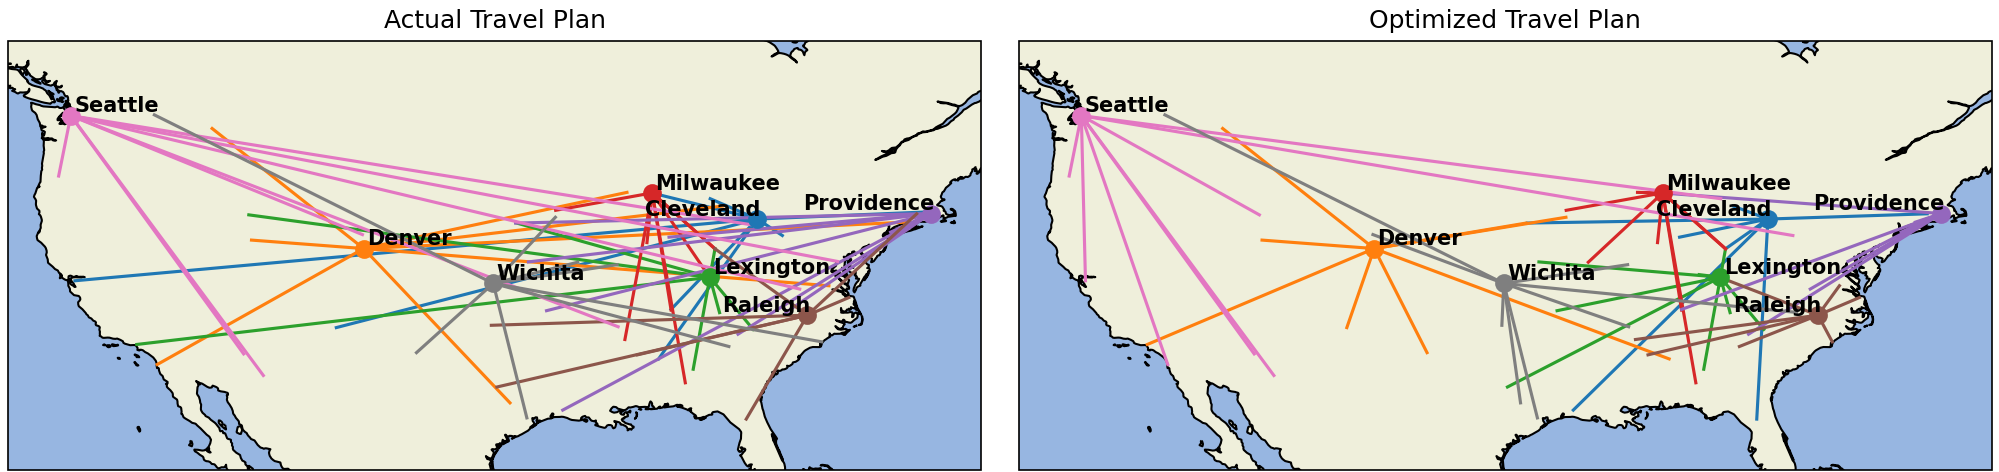
Optimized Travel Map
The map below shows the savings from the actual travel for the 64 teams to one of the 8 first round locations compared to the results of our optimization model. In the 2025 men’s tournament, 21 teams have to travel over 1,000 miles to their game. Our model only makes 8 teams travel more than 1,000 miles.
Optimized Bracket
Here is the optimized bracket structure we generated to minimize travel distance to first-round sites. What do you think of these matchups? The numbers to the right of the team are the miles the team needs to travel to their first round game.
LEXINGTON                     RALEIGH
 1 Auburn          380         1 Duke             18
16 Mount St Marys  118        16 Norfolk St      154
 8 Louisville       69         8 Mississippi St  595
 9 Baylor          844         9 Georgia         293

SEATTLE                       PROVIDENCE
 5 Oregon          250         5 Clemson         791
12 UC San Diego   1053        12 Liberty         516
 4 Arizona        1220         4 Maryland        350
13 Grand Canyon   1111        13 Yale             87

DENVER                        RALEIGH
 6 BYU             353         6 Mississippi     619
11 Drake           608        11 VCU             139
 3 Texas Tech      460         3 Kentucky        355
14 Montana         666        14 UNC Wilmington  119

DENVER                        PROVIDENCE
 7 UCLA            838         7 Marquette       845
10 New Mexico      335        10 Vanderbilt      913
 2 Alabama        1068         2 St Johns        145
15 Omaha           484        15 Bryant           9

======================       =======================

CLEVELAND                     WICHITA
 1 Florida         819         1 Houston         562
16 Alabama St      179        16 SIU Edwardsvil  405
 8 UConn           487         8 Gonzaga        1225
 9 Creighton       738         9 Oklahoma        171

CLEVELAND                     WICHITA
 5 Michigan        119         5 Memphis         448
12 McNeese        1012        12 Colorado St     461
 4 Purdue          283         4 Texas A&M       492
13 Akron            31        13 High Point      965

MILWAUKEE                     MILWAUKEE
 6 Illinois        204         6 Missouri        365
11 North Carolina  299        11 Xavier          299
 3 Wisconsin        76         3 Iowa St         300
14 Lipscomb        483        14 Troy            784

LEXINGTON                     SEATTLE
 7 Kansas          584         7 Saint Marys     676
10 Arkansas        550        10 Utah St         657
 2 Tennessee       148         2 Michigan St    1857
15 Wofford         257        15 Robert Morris  2121
Summary
| Actual Bracket | Optimized Bracket | |
|---|---|---|
| Total Miles | 102,000 | 68,000 |
| % Reduction | – | 33% |
| Bus Travel | 17 teams | 25 teams |
| Flights Saved | – | 16 flights |
| Teams >1,000 mi | 21 | 8 |
Why Travel Matters
Of course, the NCAA selection committee has more to consider than geography—things like seeding, TV schedules, conference restrictions, and fan bases. But this experiment highlights a key truth:
Even simple mathematical models can uncover huge savings—whether in miles, dollars, or time.
In the real world, optimization like this powers airline crew scheduling, delivery routing, supply chain design, and even renewable energy planning. The NCAA might not adopt our version of the bracket anytime soon, but the same tools can make a real impact in business.
If you’re curious about how optimization can drive smarter decisions in your business—even if it’s not about basketball—we’d love to chat.